


OpenTelemetry Graduation: Instrumenting AI Models in Kubernetes for Real Observability
Hitesh Sondhi · August 10, 2026 · 10 min read
We shipped a Qwen3-8B inference service on Kubernetes last quarter and realized three weeks in that we had no visibility into why latency spiked every few hours. Cluster autoscaler logs looked clean. Pod CPU was nominal. This problem lived inside the model serving container, and our Prometheus scrapers couldn't see it.
That gap between infrastructure metrics and model behavior is where most AI deployments lose money and user trust. OpenTelemetry's CNCF graduation in May 2026 gives us a stable, vendor-neutral standard to close it, but the instrumentation patterns for AI workloads are still poorly documented.
Key Takeaways
OpenTelemetry graduated from CNCF on May 21, 2026, with 2.6 billion downloads in the prior twelve months, making it safe to standardize on for production AI observability ([dev.to](https://dev.to/cyberandyou/opentelemetry-cncf-graduation-the-turning-point-for-production-ai-observability-in-kubernetes-1a0h)).
Model telemetry needs three signal types that standard web instrumentation misses: [inference latency distributions](/blog/when-prompt-batching-fails), feature drift, and token throughput.
The [OpenTelemetry Collector is the right aggregation point in Kubernetes](/blog/llmops-best-practices), not per-pod exporters that duplicate the Prometheus pattern.
Semantic conventions for GenAI are still draft, so you need custom attributes today but should plan for standardization.
What CNCF Graduation Actually Means for Your Stack
OpenTelemetry officially graduated at the CNCF Observability Summit in Minneapolis on May 21, 2026, joining Kubernetes, Prometheus, and Envoy at the highest maturity level (dev.to). Graduation required passing a third-party security audit, demonstrating adoption across major vendors, and showing a healthy contributor base. Engineering teams get a stable API surface to build against, without worrying about breaking changes in the next release.
Downloads hit 2.6 billion in the twelve months before graduation, telling you the ecosystem has arrived (dev.to). SDKs exist for Python, Go, Rust, Java, JavaScript, and C++. Collectors run as a DaemonSet, Deployment, or sidecar. Every major observability backend accepts OTLP natively now (OpenTelemetry docs).
What graduation does not give you is opinionated instrumentation for AI models. OpenTelemetry's semantic conventions for GenAI are still in draft (OpenTelemetry semconv). HTTP, database, and messaging spans are covered well, but inference calls, token counts, and embedding generation need custom attributes today.
Why Standard Kubernetes Monitoring Fails for AI Workloads
Your typical Kubernetes monitoring stack gives you CPU, memory, network, and disk per pod. Maybe you add a custom Prometheus counter for request count. This works for a web API where request latency is a function of database query speed and serialization overhead.
AI inference breaks that model. A single request to a Qwen3-8B model might take a fraction of a second or several seconds depending on prompt length, batch size, and whether the KV cache is warm. CPU utilization during inference is high but not linearly correlated with latency. Memory pressure from the KV cache can cause sudden throughput collapse that looks like a normal GC pause on a standard dashboard (vLLM docs).
This pattern shows up repeatedly when building custom model serving infrastructure. Infrastructure metrics say everything is fine while users experience multi-second response times. You need telemetry that spans the gap between the Kubernetes layer and the model layer.
The Instrumentation Pattern That Works
Here's the architecture we use for AI model observability in Kubernetes. It's not clever. This is the boring, reliable pattern that OpenTelemetry graduation makes possible.
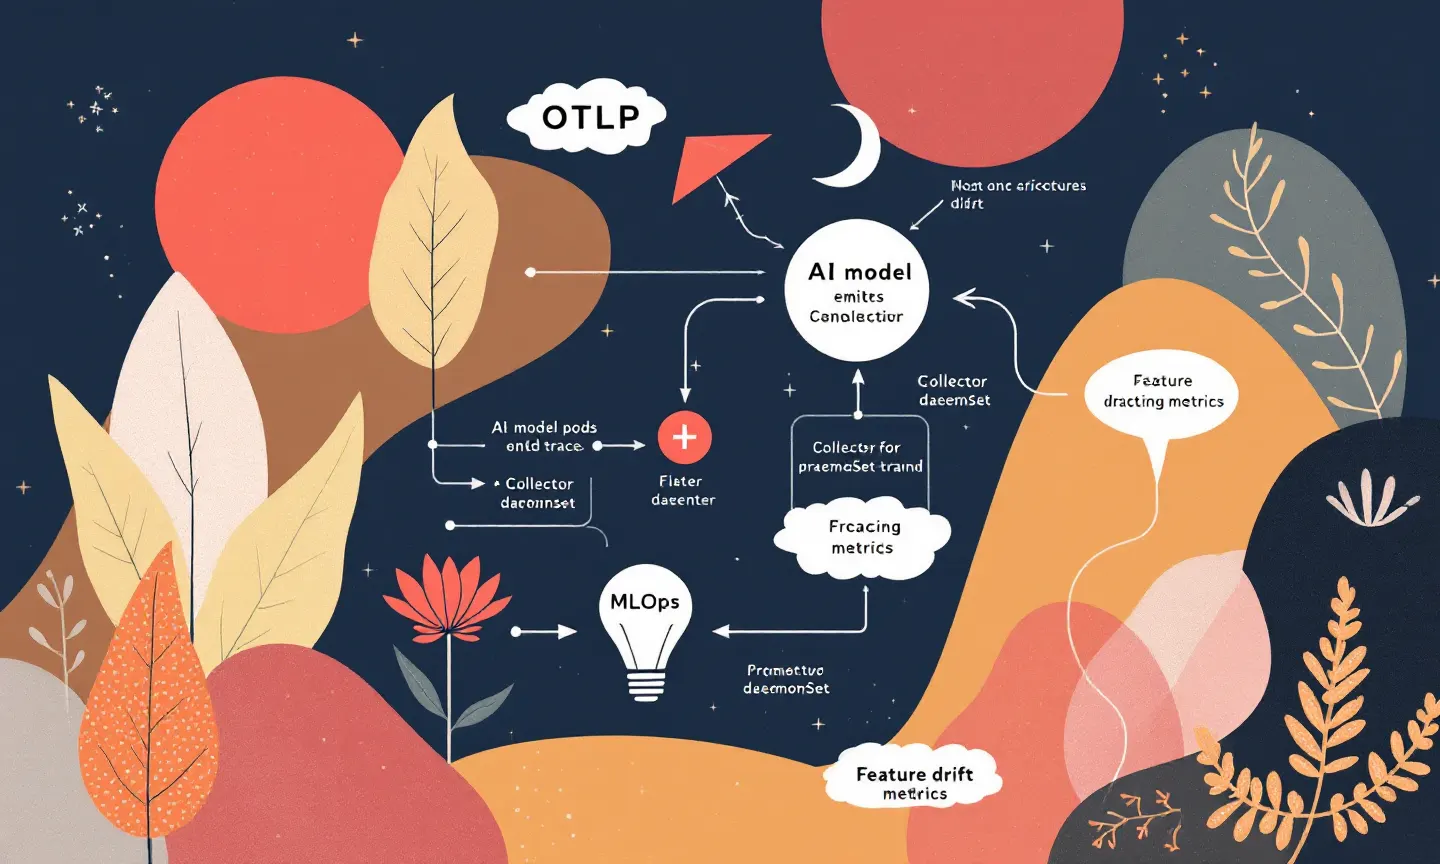
Your model serving pod runs an OpenTelemetry SDK that emits three signal types: traces for individual inference requests, metrics for aggregate throughput and latency, and logs for structured error output. All three go to the OpenTelemetry Collector running as a DaemonSet on each node (Collector docs). Batching, retry, and export to your backend of choice are handled by the Collector.
Inference Latency as Distributed Traces
Each inference request gets a root span with attributes for model name, model version, prompt token count, and completion token count. Inside that span, you create child spans for the operations that actually matter: tokenization, KV cache lookup, forward pass, and detokenization.
from opentelemetry import trace
from opentelemetry.trace import Status, StatusCode

tracer = trace.get_tracer("model-serving")

async def infer(self, prompt: str, model: str):
    with tracer.start_as_current_span("inference") as span:
        span.set_attribute("gen_ai.model.name", model)
        span.set_attribute("gen_ai.model.version", "v1.2.0")

        with tracer.start_as_current_span("tokenize"):
            input_ids = self.tokenizer.encode(prompt)
            span.set_attribute("gen_ai.input_tokens", len(input_ids))

        with tracer.start_as_current_span("forward_pass"):
            output = await self.model.generate(input_ids)

        with tracer.start_as_current_span("detokenize"):
            result = self.tokenizer.decode(output)
            span.set_attribute("gen_ai.output_tokens", len(output))
            span.set_attribute("gen_ai.response.finish_reason", "stop")

        return result
Span attributes follow the draft GenAI semantic conventions where they exist (OpenTelemetry semconv). Our code adds gen_ai.input_tokens and gen_ai.output_tokens because token throughput is the metric that actually tells you whether your model is healthy. A model serving tens of tokens per second on an A10 GPU is running at expected speed. When that drops by two-thirds, something is wrong with the GPU, the batch scheduler, or the model weights, and no CPU metric will tell you that (vLLM PagedAttention).
Feature Drift as Custom Metrics
Feature drift detection is where most teams reach for a separate MLOps platform. That's expensive and creates another data silo. Instead, emit drift metrics through OpenTelemetry and let your existing backend handle alerting.
Our approach instruments the model's input features as histogram metrics. A text model gets prompt length distribution, language distribution, and topic embedding distance from a reference set. A tabular model gets each input feature's running statistics compared to the training distribution.
from opentelemetry import metrics

meter = metrics.get_meter("model-observability")
prompt_length_hist = meter.create_histogram(
    "gen_ai.prompt_length",
    description="Distribution of prompt token counts",
    unit="tokens"
)

def record_request(prompt_tokens: int, language: str):
    prompt_length_hist.record(prompt_tokens, {
        "gen_ai.language": language
    })
These get exported to Prometheus by the Collector, and you alert on percentile shifts. When the ninety-fifth percentile prompt length jumps from a few hundred tokens to nearly a thousand overnight, your model is handling a different workload than it was trained for. That's not an error. It's a signal that you need to evaluate retraining or adjust your context window.
Token Throughput as a First-Class Metric
Token throughput is the metric we care about most for our on-device AI deployments and server-side inference alike. It's the throughput equivalent of requests-per-second for a web API, but it accounts for the actual work the model is doing.
Two gauges get emitted: gen_ai.tokens_per_second and gen_ai.concurrent_requests. This ratio tells you whether your model is scaling linearly with batch size or hitting a memory bandwidth bottleneck. When we serve Qwen3-8B on a Jetson Orin for our RunHotel product, that ratio is the single most useful number for capacity planning.
Integrating with Existing MLOps Pipelines
Collecting telemetry isn't the hard part. Getting that telemetry into the pipelines that drive model retraining, evaluation, and deployment decisions is. OpenTelemetry gives you the transport layer. Integration work is on you.
Your Collector should export to two destinations in parallel. One is your observability backend for dashboards and alerting. Another is a message queue, typically Kafka or Redis Streams, that your MLOps pipeline consumes. Collector connector architecture supports fan-out natively, so you don't need a separate process for this (Collector docs).
Your MLOps pipeline then reads traces and metrics from the queue and feeds them into drift detection, evaluation triggers, and retraining decisions. When feature drift exceeds a threshold, the pipeline triggers an evaluation run against a held-out test set. When evaluation accuracy drops below your SLA, the pipeline triggers a retraining job. This is the closed loop that makes observability actionable rather than just visual.
Teams building AI agents that call multiple models in sequence get an audit trail from the distributed trace. Each model call is a span in a larger trace, and the trace context propagates through your agent orchestration layer. When an agent fails, you can see exactly which model call produced the bad output, what the input was, and how long it took.
What to Avoid
Don't run per-pod Prometheus exporters for model metrics. Prometheus's scrape model pulls data at fixed intervals, which means you lose the per-request granularity that makes distributed traces useful. You also end up with cardinality explosions when you label metrics with model version, prompt language, and request type. Collectors handle batching and cardinality management better than a Prometheus exporter ever will (Prometheus docs).
Don't build a custom telemetry pipeline. Teams sometimes write their own gRPC streaming clients to send model metrics to a custom backend. Every minute spent on that is a minute not spent on model quality. OpenTelemetry graduation means the standard is stable. Use it.
Don't conflate infrastructure observability with model observability. Your Kubernetes cluster can be perfectly healthy while your model serves garbage. They need different instrumentation, different alerting thresholds, and different on-call responses. To understand the full picture of what we recommend for AI consulting engagements, model observability is always the first workstream.
How Much Does This Actually Cost?
Running the OpenTelemetry Collector as a DaemonSet costs roughly a hundred megabytes of memory per node and negligible CPU (Collector docs). That's cheaper than any commercial APM agent we've evaluated. SDK overhead in your model serving process is in the low single-digit milliseconds per request, which is noise compared to inference latency.
To model the full cost of your observability stack before committing, our AI cost estimator includes telemetry overhead as a line item. Most teams overestimate this cost by a factor of three because they're pricing it like a commercial APM vendor, not like a self-hosted Collector. When unsure about the tradeoffs for your specific stack, reach out and we can walk through the numbers.
What Happens When the GenAI Spec Stabilizes?
GenAI semantic conventions are moving toward stabilization (OpenTelemetry semconv). Once they're finalized, the custom attributes we're setting today will need to be renamed. That's a migration cost you should budget for, not a reason to wait. Patterns we've described here won't change, only the attribute names will.
A bigger open question is whether OpenTelemetry will add first-class support for model evaluation metrics. Right now, you can emit evaluation scores as custom metrics, but there's no standard span or metric type for "model accuracy on test set X." This is a gap the community needs to fill.
Teams instrumenting AI models in Kubernetes today should use the pattern we've described. This approach is stable, cheap, and gives you the visibility that Prometheus alone can't. A question worth taking to your team is this: who owns the semantic convention migration when the GenAI spec stabilizes, and will that person also own the drift detection thresholds, or should those be split between platform engineering and ML engineering?